1. Corporate Profile: Diverse Contents to Get to Know Companies in Just 1 Minute
We visualize the financial data announced by companies into graphs so that you can understand it at a glance. In just 1 minute, you can see the growth potential, financial status, and management efficiency of companies that interest you. With just one click, you can compare them with their competitors on the graph. If you register as a member, you can also see professional analysis comments, so please take advantage of them.
By our original algorithm
Model analysis and visualization
Rough Corporate Valuation
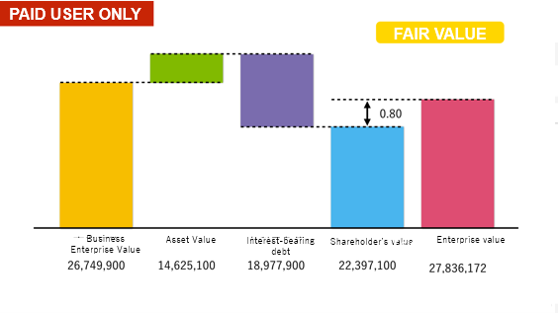
We calculate and graph the corporate value using our original algorithm with the DCF (Discounted Cash Flow) method. You can see the degree of undervaluation (overvaluation). We also provide an indicator that makes it easy to understand the degree of undervaluation with a five-star rating, so please use it for corporate evaluation.
Robot Prediction
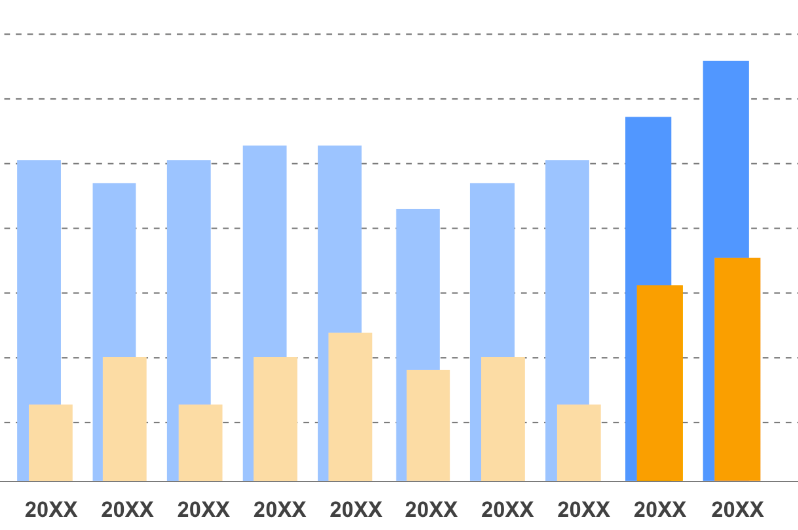
Our unique algorithm predicts future sales and operating profits for the next 2 years based on each company's business model and past financial data. Actual company performance may be affected by market conditions and may not be reliable, but this can be useful in evaluating companies.
Business Model Analysis
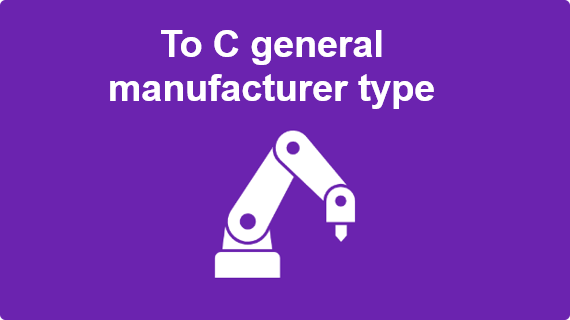
We classify business models into 24 categories using our unique logic based on past financial data and company overview, and display them with icons and colors. You can easily understand the business model at a glance and use it for company analysis.
CorpoRoid(CorpoRoid)

Analysis of the characteristics of a company's business model and corporate structure from past financial data and visualized as a character. The characters are lined up over time, allowing you to easily grasp the state and trends of the company at a glance.
Value Chain Analysis
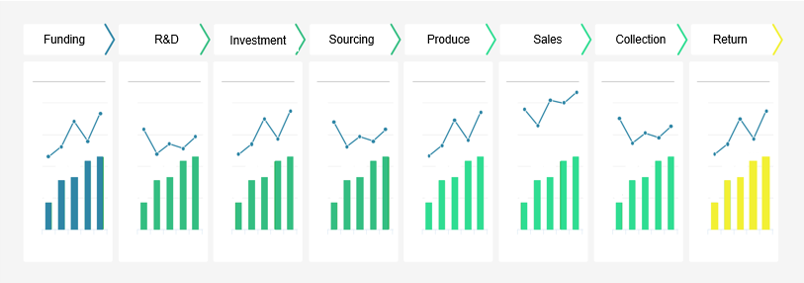
This graph displays important indicators related to the value chain in a single column. You can check the value creation flow of the company from various data.
IR and Financial Statements-based
4 Easy-to-Read Analytical Graphs
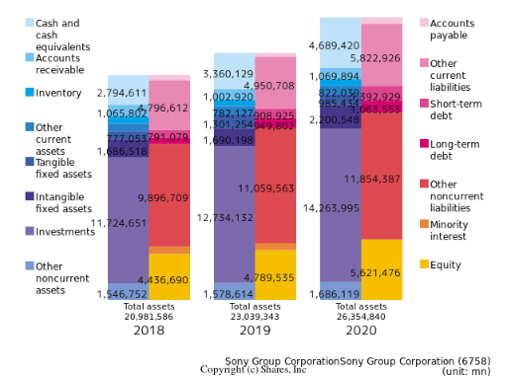
Balance Sheet (BS)
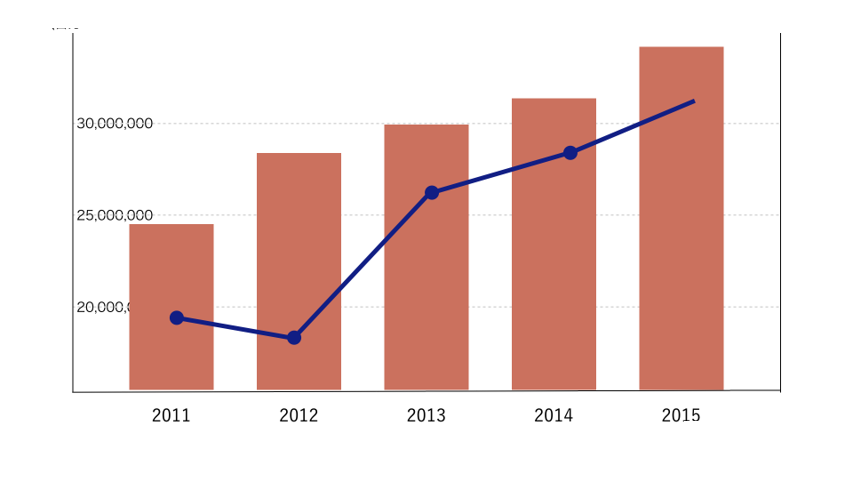
Income Statement (PL)
ROIC and Business Efficiency Analysis
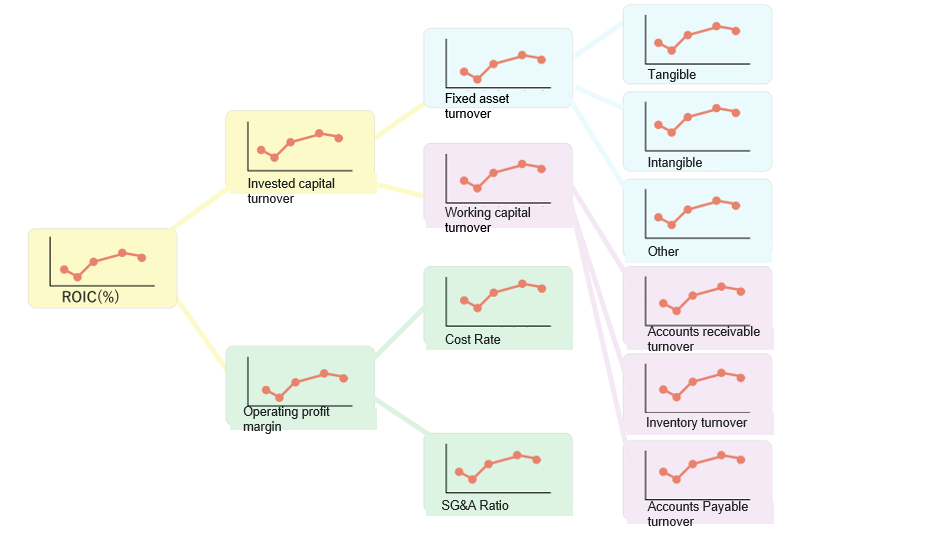
This graph shows the indicator of business efficiency (ROIC: after-tax return on invested capital) and its changes. Detailed indicators are also displayed in a tree format, allowing for detailed analysis.
Cash Flow Statement (CF)
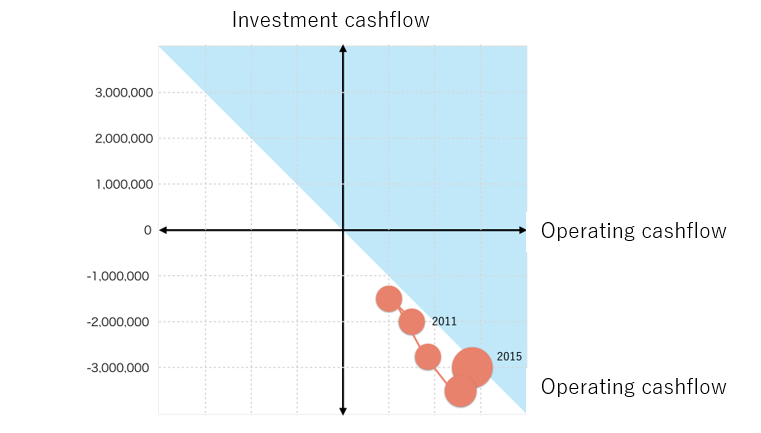
The past 20 years of the BS, PL, and CF of listed companies are graphed. You can switch between short-term, medium-term, and long-term trends with just one click.
Comparison Graph for Easy Comparison with Competing Companies
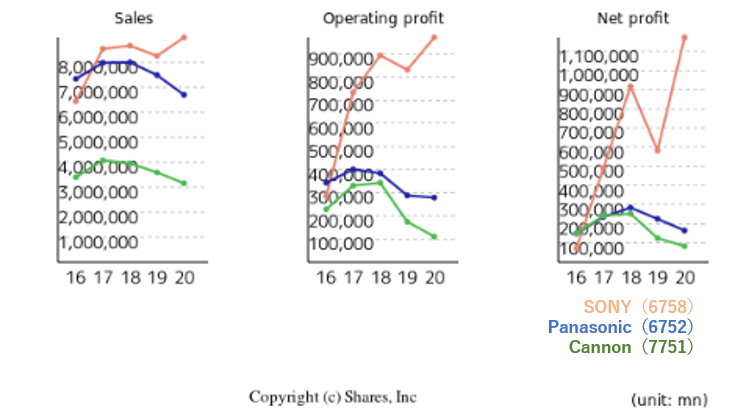
Up to 3 companies can be compared on the same graph for multi-faceted analysis. Compare companies of interest to get a comprehensive view.
Expert Analysis Comments
(for members only)
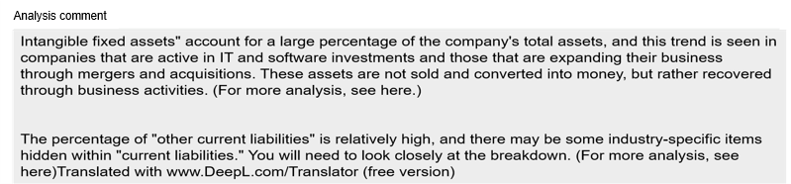
You can read comments from experts on what points to focus on and how to interpret financial data for each company's BS, PL, and CF. Even if you don't have knowledge of finance or corporate analysis, your investment skills can be improved by reading comments and looking at graphs. Please use it from the good stock search page after registering as a member. We also have a list of companies categorized by expert analysis, so please use it.
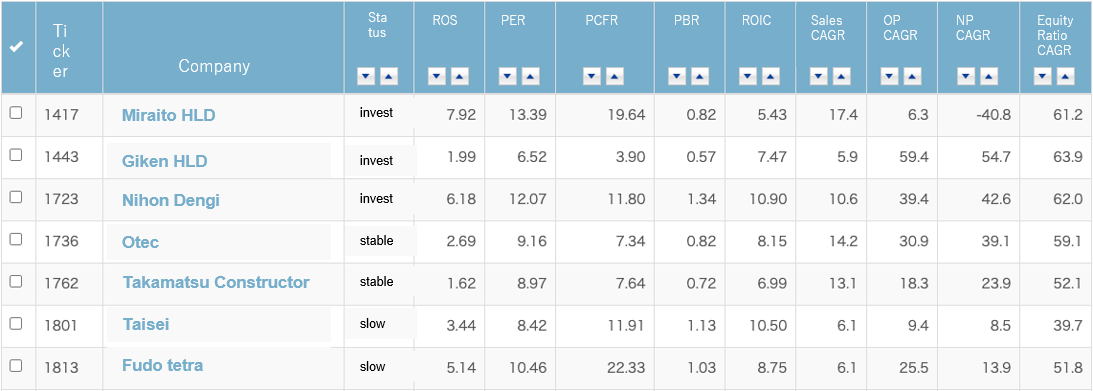
2. Good Stock Search: Easily Screen Companies by Criteria (Members Only)
Comments from professionals on what to pay attention to when looking at the financial statements (BS, PL, CF) of each company are available to read. Even if you don't have knowledge of finance or corporate analysis, your investment skills can be improved by reading the comments while looking at the graphs. After registering as a member, please use it from the Good Stock Search page. We also provide type-specific company lists that have been fine-tuned by professionals, so please take advantage of them.
Find companies that fit your investment style with our type-categorized screenings tuned by M&A professionals.
Click on the Verify Returns button below. You can calculate the average return on your investment over the past year.
Learning Content (members only)
You can watch learning videos related to stock investment, depending on the plan you have subscribed to. Please use it to improve your investment skills.
Corporate Analysis Report (Paid)
How about requesting a second opinion corporate analysis report? You can request a professional analyst to analyze the reality of a company that you are not sure about. Even if you don't know what to analyze, the analyst has prepared analysis points for you.
For beginner to mid-level investors, corporate analysis requests start at
¥29,800 per company
*For mid-level investor plan members, it starts from ¥9,800 per company per month
Q. I'm not good with numbers or accounting and don't understand the financial situation of companies.
A. Please request an analysis of the financial health.
Q. I want to know why a particular company is profitable.
A. Please request an analysis of the business model.
Q. I want to predict the future of my held companies, but don't know how.
A. Please request an analysis of the industry and future market environment.