TOP > Toyota Motor Corporation【7203】
| Principal Businesses | - |
|
Principal Products・ Services |
Sedans, minivans, compact cars, sport-utility vehicles, trucks and related parts and accessories; Financing, vehicle and equipment leasing and certain other financial services |
|
Principal Products・ Services Main Products and Services(Original) |
Sedans, minivans, compact cars, sport-utility vehicles, trucks and related parts and accessories; Financing, vehicle and equipment leasing and certain other financial services |
| Securities Code | 7203 |
| Type of Industry | - |
| Last fiscal year | 2023-08 |
| Number of shares per unit (minimum purchase amount) | 100 (222,100yen) |

Business Model Analysis
The Business Model Analysis is a classification of Japanese listed companies into 24 business models, based on the company's financial data and qualitative data, and analyzed using SHARE's proprietary logic.
The classification is based solely on the characteristics and outline of the financial statements, and the classification is the result of the judgment that the company has the characteristics of each model as a rough feature.AI Forecasting uses forecasting formulas according to these business models to estimate a company's future sales and profits.
toC general manufacturer type

Corpoloid.
It is an image of a company personified according to its characteristics.
The detailed differences in characteristics for each company are represented by weapons, armor, youth, body shape, size, what they carry, and rarity.


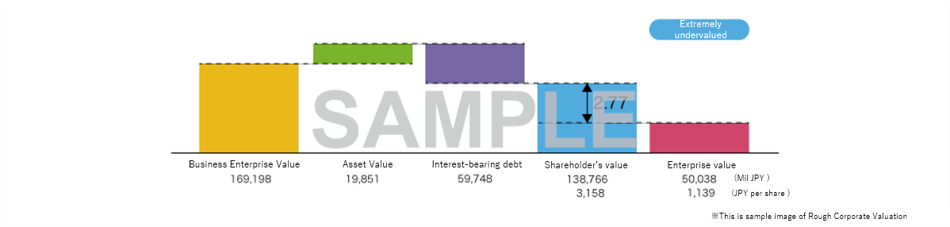
How do you judge "this is expensive OR cheap" when shopping?
Probably, you think about the "value" of the product.
When buying or selling a company's stock, it is important to consider shareholder value.
With "A rough assessment of the company's value (DCF)," you can quickly find the "shareholder value" of all listed companies with just one click."
Robot prediction
A Robot prediction is a number calculated from a company's financial statements and business model to determine future sales and profits. It is only a simplified forecast based on past numbers and models and its accuracy is not guaranteed.
For more details and ValuationMatrix's thought process, click here.Value Chain Analysis
Value Chain Analysis, sometimes referred to as Business Process Analysis, is a function that allows you to check the "status of each process of the business. It is possible to confirm changes in the financial status of each process, such as R&D, purchasing, production, and sales.
Since this function generalizes processes that originally differ from company to company and business to business and uses general financial figures, it is not accurate enough to replace detailed analysis for each individual company. It is intended to be used only as a general overview and to grasp changes.
Please note that not all businesses share the same processes, so some processes may not be displayed depending on the business model or company.

Financial Leverage

Dividend Rate
New Investment Rate

Sales Cost Rate
Fixed Asset Turnover
Revenue per Person
[Frequently Compared Companies] Click to select a company
Mazda Motor Corporation / DAIHATSU MOTOR CO LTDDAIHATSU MOTOR CO LTD / Subaru Corporation / Hino Motors LTD / Aisin Corporation / Denso Corporation / Toyoda Gosei CO LTD /
バリューチェーン分析
バリューチェーン分析はビジネスプロセス分析とも言われることもあるとおり、「事業の各プロセスの状況」について確認できる機能です。研究開発・仕入・生産・販売など各プロセスの財務数値上の状況変化が確認できます。
本来、プロセスは会社ごと・事業ごとに異なるものを一般化し、かつ一般的な財務数値を使っているため、個社ごとの詳細分析の代わりにはなるほどの精度はありません。概略や変化を掴む目的でご利用ください。
なお、すべてのビジネスで共通のプロセスがあるというわけではないため、ビジネスモデルによって・会社によっては表示されないプロセスもございます。

Financial Leverage
Sales Cost Rate
R&D Expense Ratio
New Investment Rate
Fixed Asset Turnover
Revenue per Person
ART Month
Dividend Rate
Toyota Motor Corporation(7203)
Net Assets
Sales Cost
Research and Development
New Investment in FA
Fixed Asset Amount
Revenue
Operating Cash Flow
Total Dividends
Toyota Motor Corporation(7203)
Balance Sheet/BS
For example, when looking at the state of a household's finances, you would check assets such as "savings" and "car" and husband and wife such as "mortgage" in a household account book.
The balance sheet (BS) plays the same role as a corporate household account book. It is a useful table to know the size of the company and its assets. Generally speaking, households in companies with large assets and small liabilities...in other words, companies with large equity are healthy.
Analysis Commentss


User Comments
No comments
Profit and Loss Statement, PL
No matter how good you are at selling something, it is meaningless if there is no profit left at hand. The same is true for a company; what is important is "profit" rather than sales. The income statement (PL) is a useful tool for understanding how profitable a company is. Operating profit is the profit earned from the core business. It is calculated by subtracting expenses such as raw materials and labor costs from net sales.
Net income is the profit that ultimately remains in the company after subtracting taxes and other expenses from operating income.
*In terms of individuals, it can be said to be equivalent to "take-home pay" rather than face value. A company with a steady increase in operating profit is a good company.
User Comments
No comments
Cash Flow Statement.
You could say that people who spend money within their take-home pay are smarter households. In the same way, there are "doers" in a company.
Cash flow is the flow of money into or out of a company over a certain period of time. The most notable of these is free cash flow, which is the difference between earning and investing. A company with positive free cash flow (inside the blue triangle in the figure) can be said to be doing well.
When judging corporate value, such companies that are good at making ends meet (i.e., companies with positive free cash flow for multiple years in a row) are valued more highly.
Analysis Comments
User Comments
No comments
Management Efficiency Analysis (ROIC Tree)
Management Efficiency Analysis (ROIC Tree)
Return on invested capital after tax (ROIC) is an indicator of how much a company has returned on its investment.
Depending on the industry, it is better to have at least 5%, and 10% or more indicates a good company.
Analysis Comments
User Comments
No comments
Multiple valuation (operating income multiple, PER, CF multiple, PBR)
Management Efficiency Analysis (ROIC Tree)
Return on invested capital after tax (ROIC) is an indicator of how much a company has returned on its investment.
Depending on the industry, it is better to have at least 5%, and 10% or more indicates a good company.
Analysis Comments
User Comments
No comments